The momentum behind a movement to reduce residential speed limits is building, not just in Winnipeg but in larger cities all over the world. Calgary city council recently voted to reduce their residential speed limit to 40 km/h. The UN and WHO are pushing for reduced residential speeds. Outspoken individuals and advocacy groups have sprung up everywhere pushing for changes to make our streets safer, including Safe Speeds Winnipeg, whom I wrote about earlier.
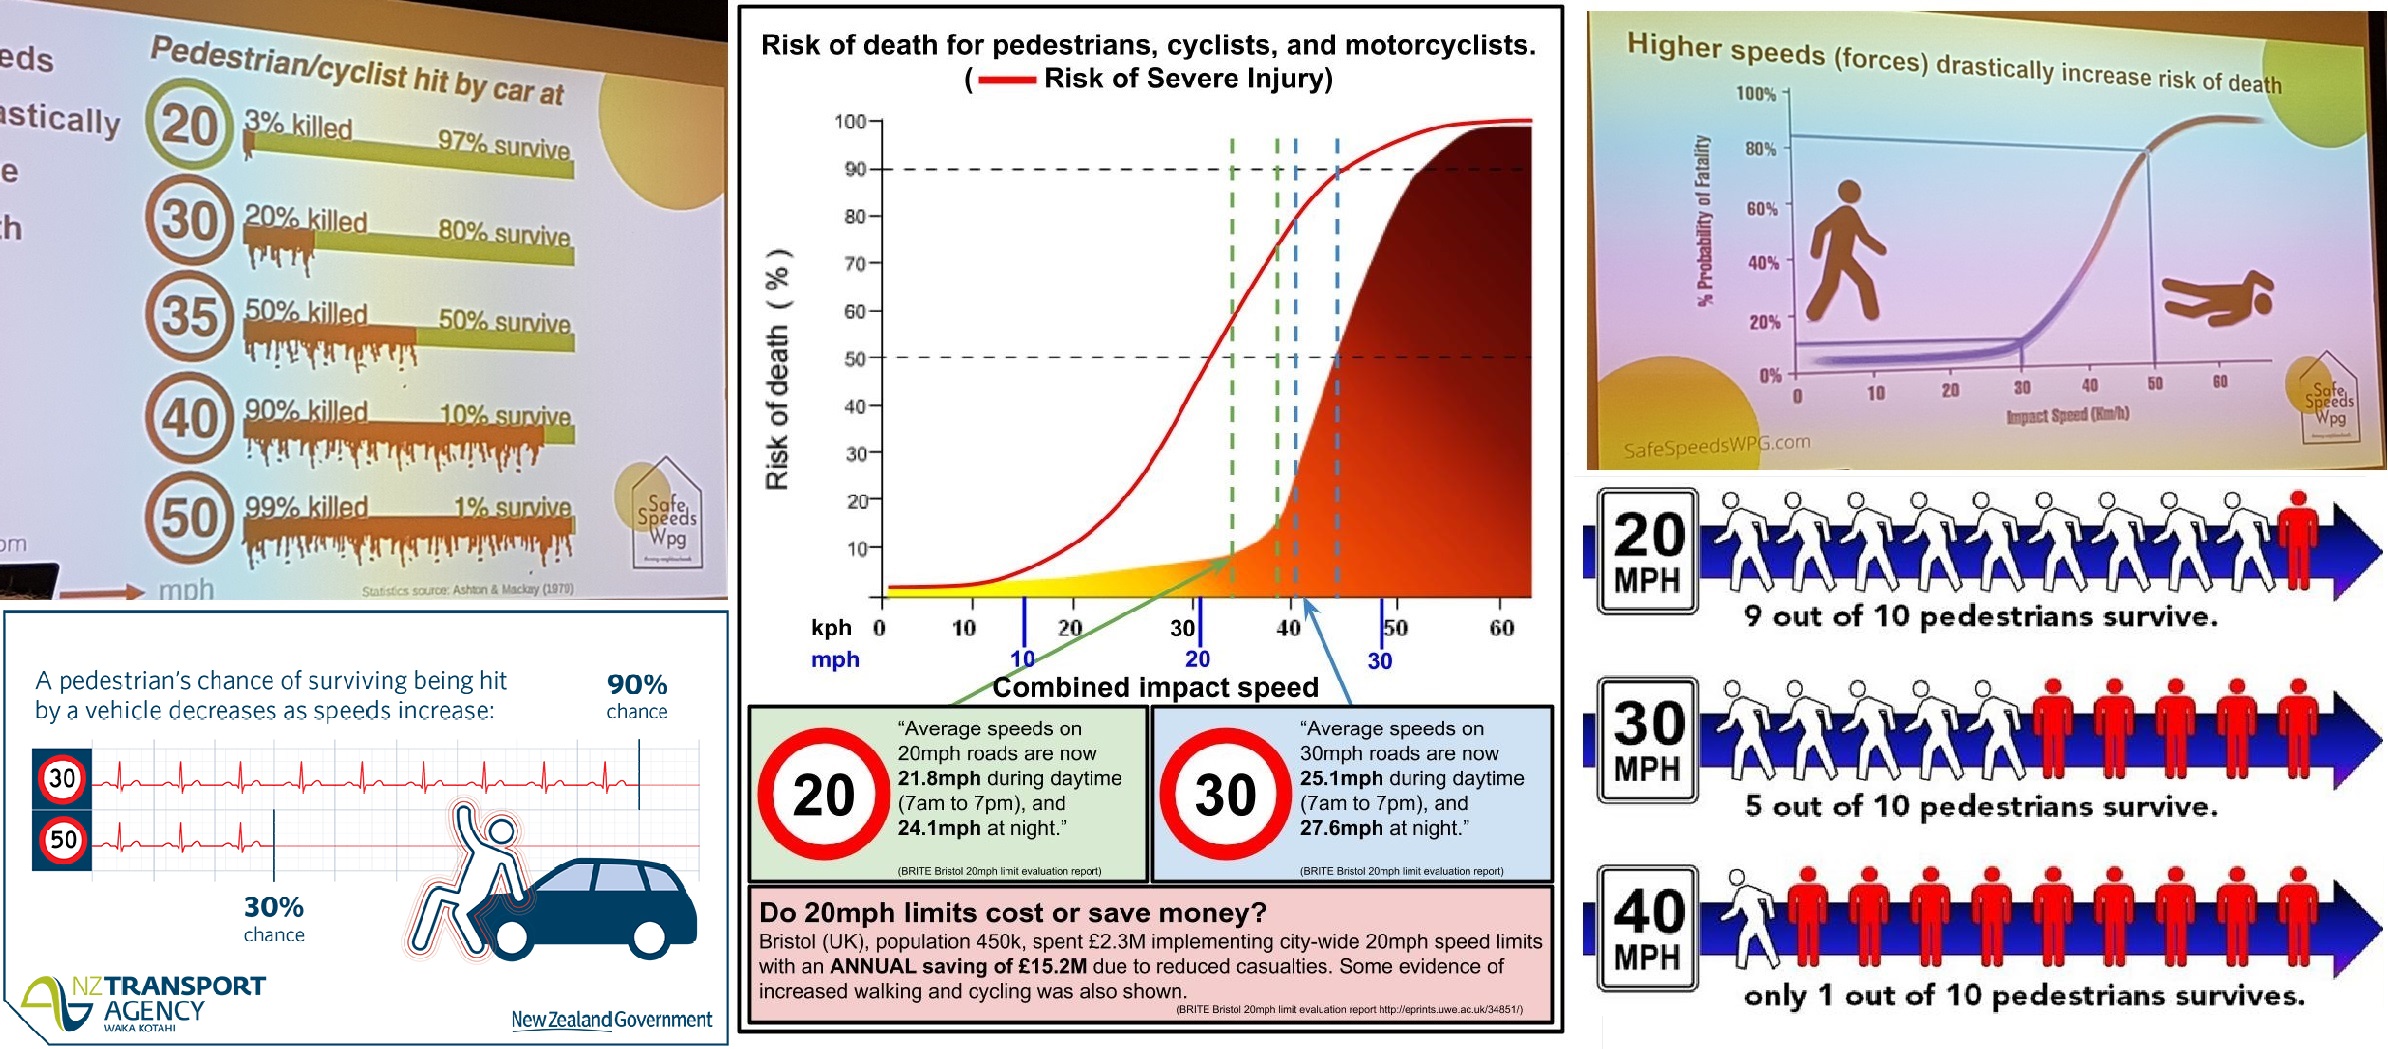
Something you often see presented as evidence that slower speeds are needed is a diagram showing how fatality rates are unacceptably high at 50 km/h — the default speed limit for residential streets in Winnipeg and most Canadian cities. One thing those diagrams often disagree on is what that fatality rate is.
I have seen a chart showing that 20% of pedestrians die at 50 km/h. I have seen another showing that it’s closer to 90%. What is the real figure? Where did this data come from? Ask whoever is showing the chart for a source for their data and be prepared for silence.
I think we need to clear this up because the best way to advocate for change is to have your facts straight, and on this score the slow streets movement is missing the mark. Yet despite the vast differences in data and the inability or unwillingness to provide references, we are expected to accept this evidence without question. A tweet last fall (yes it takes me half a year to write a blog post) finally pushed me over the edge:

The tweet was in response to the outreach campaign by the City of Calgary department of transportation to solicit feedback on a plan (successful as noted earlier) to reduce speeds to 40 km/h — but not the 30 km/h that Martyn’s unsourced graph says it should be.
Martyn could have tweeted something like:
“the campaign to reduce speeds to 40 km/h is progress, but we can do better! There is evidence that 30 km/h will reduce fatalities. Let’s push for that.”
But he didn’t do that. Instead he said that it should be 30 km/h according to “science” and anyone who disagrees with him is “fucking stupid”. So of course I asked him where he got his data from (twice) and of course he did not respond. (Note: he did tone down the language in later tweets.)
He is not the only one sharing graphs and representations showing this same sort of thing, and also not the only one who has refused to provide a source for his/her data. Sometimes you can dig up the origination of a graph, but there is no detail about where the data came from.
Even without looking at the actual data, many people will recognize that 90% of pedestrians do not die from collisions on residential streets, because you simply do not see that many stories about car-pedestrian fatalities in the media. When you do see them they usually relate to a major thoroughfare and not a street like the one you live on. If someone is trying to sell you something that doesn’t smell right, you’re going to tune them out. Which is why, if the slow-speed advocates want change, they need to get their facts straight.
So let’s dig into this a little bit ….
Most studies I found were from Europe, where pedestrian safety seems to be more of a concern. Let’s start with D.C. Richards out of London, UK. Richards looked at 3 sources of data from the UK and found that “In all of the pedestrian datasets, the risk of fatality increases slowly until impact speeds of around 30 mph” (or approximately 50 km/h.)
Richards also referenced a detailed statistical analysis which you can view HERE by Erik Rosén and Ulrich Sander using German data. Turns out the Germans do a bang-up job of collecting accident data. Taking advantage of that comprehensive data they looked at fatalities as a function of speed.
Their charts are sadly lacking in the colour red and representations of dead bodies, but they show a similar “S” curve that some of the more graphic graphics often show …
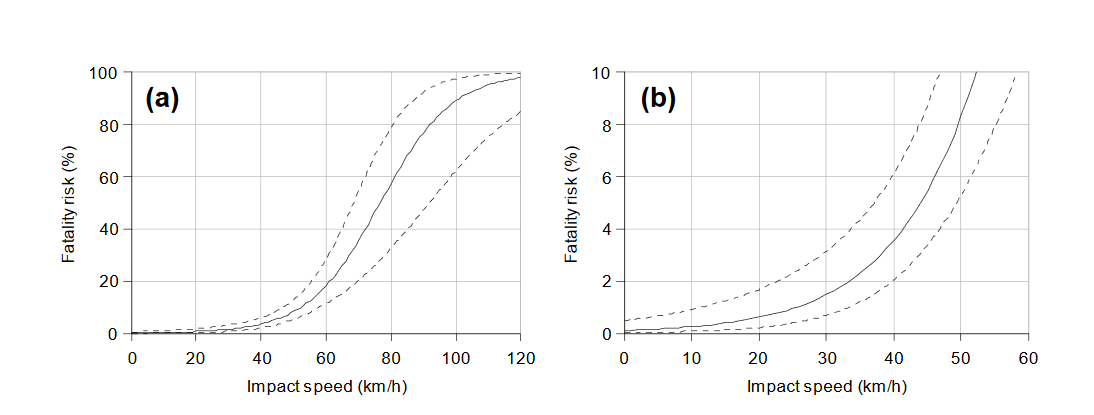
… the difference being where the largest rise in fatalities begins. Here, a speed of 50 km/h aligns with an 8% fatality risk (within a 95% confidence interval), with the risk rising rapidly beyond that. Although North Americans may drive larger vehicles, their 8% risk is very similar to the overall fatality rate for Winnipeg (7%) according to MPI’s data.
Rosén and Sander begin their article with a review of the literature. Some of those studies have very different results: Anderson et al. (1997) show pedestrian fatality rates of 85% at 50 km/h and 100% (ONE HUNDRED PERCENT!!) at 70 km/h. Unfortunately, their “unconventional approach” was “based on only 56 accidents with a substantial bias towards severe injuries, thus yielding crude and exaggerated risk estimates.”
Ashton et al. (45% fatality at 50 km/h) acknowledged that their own data contained a sample bias such that “fatality rates did not give a fair description of the total population of accidents.” yet they remain widely cited, as does Yaksich (65% at 50 km/h) whose data is so old (50s & early 60s) that most cars had drum brakes in their front wheels.
Some more recent studies (Cuerden et al. (2007), Davis (2001), Hannawald & Kauer (2004)) have results much more similar to those of Rosén and Sander. One is based on 50-year old Ashton data that was reworked to remove the sample bias.
If I can try to summarize: there is a lot of conflicting and suspect data out there. If you want to make a chart showing a pile of 8 dead bodies out of 10 above “50 km/h” you can find a study to support that. Probably not a recent one, or one that would pass peer review for a modern journal, but you can find one.
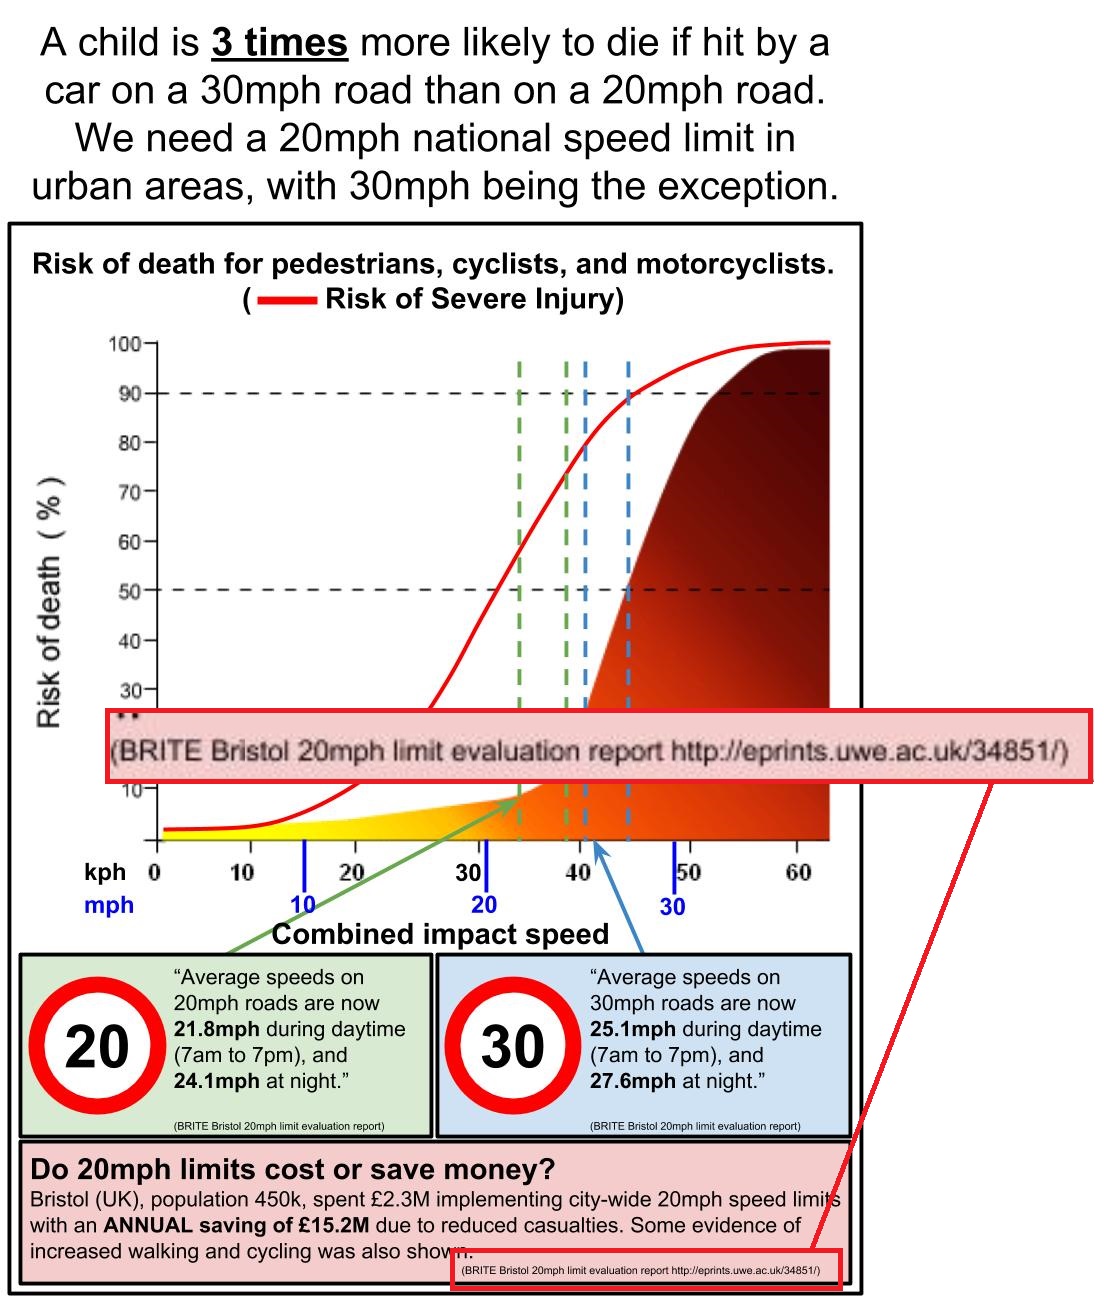
Or you can provide a source that doesn’t actually corroborate your data, like this graphic:
Cudos to them for actually providing a LINK!
However, it doesn’t contain the data shown in their graph, and it also acknowledges that “most of the evidence from studies on 20mph limits to date is cross-sectional, has relatively short follow-up periods, and is potentially confounded by a range of factors”
Again .. suspect data. But there is one other thing they said that I want to key on:
Other potential wider benefits of 20mph limits, including improved levels of wellbeing and community cohesion among residents, have not routinely been researched.
This is what I think Safe Speeds Winnipeg and other advocates for reduced speeds need to focus on, versus fatality rates — other wider benefits of slower speeds like more livable, walkable and kid-friendly neighbourhoods.
Yes, push the safety aspect as well. Even if actual fatality rates at current Winnipeg residential speeds aren’t jaw dropping, fewer accidents and fewer injuries are still a good thing, and more vulnerable people will especially benefit. Less severe injuries, more livable communities … a compelling argument can be made here.
After all, even though D.C. Richards and Rosén and Sander show that fatality rates at 50km/h (30 mph) are “relatively low” they still advocate for reduced speeds. There are plenty of arguments to support it without using inaccurate or misleading statistics.


Great article, and appreciate the effort to find accurate data to inform this debate.
One piece I think about a lot in this debate is the speed that people actually drive relative to the speed limit. For example, when the limit is set at 50 km/hr, are a significant number of motorists adding 10 to that as a rule of thumb and doing 60? Barring a major increase in enforcement then, would you need to drop the speed to 30 km/hr just to get a sizeable number to stay under 40 km/hr?
Hi Richard. Thanks for the reply. I think it very much depends on the circumstances. Here the 50 km/h limit applies to streets that are vastly different — on some people tend to drive less than 50 already but on others they go 60. I think people tend to drive to the conditions. In that Bristol study they reduced the speed limit by 10 mph but average speeds only decreased by something like 2.7 mph because nothing physically changed about the streets. So I don’t know if there is a clear answer.
Excellent summary, and another great topic from your blog! I’m an advocate of 40 kph speed limits for my city’s residential streets. I’m not basing that on hard science and stats, and I’m glad I didn’t bother trying now that I see what your findings demonstrate! I base my judgement on… judgement, and personal experience. At 50 kph, it is too easy to push to 55 or 60 if you’re rushing or distracted, and at those speeds you may not be seeing all the details of activity around you. At 30 kph, baby mosquitos are passing you. I think 30 is excessively slow. 40 is a happy medium. 40 may push to 45 or 50, and most of us still have a good view of our surroundings at those speeds. This would also allow us to move the school zones to 40 kph, so neighbourhood speed limits are consistent. Next topic can be speed limits on thoroughfares… especially near big box and mall complexes where cross traffic and controlled intersections are a factor. Is 80 kph too much in most circumstances? I’ll get that debate started by saying “yes”.
Thanks for your comments, Tim! Intersections on major thoroughfares are definitely an issue … you just have to look at the accident rates to see a pattern emerge there.